


August 25, 2021
We turn scientists into designers. Automatically.
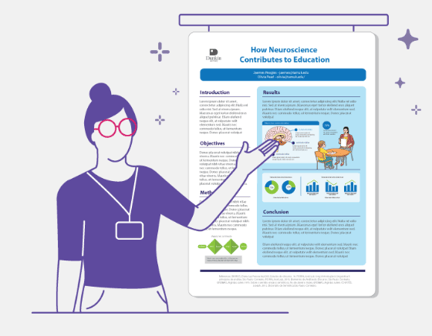
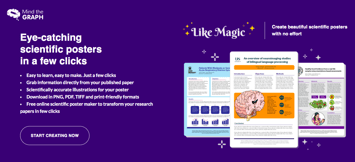 Our recently-launched product saves long hours of work for Life Science Researchers by helping them create scientific poster with just a few clicks. The product leverages a vast library of scientifically correct illustrations from Mind the Graph and a powerful artificial intelligence summarizer tool to turn any published article or conference abstract into a professional-looking academic poster with just 5 clicks.
The AI-powered Poster Maker helps the authors to communicate better and stand out in an environment where over 3,000 new scientific papers are published everyday. While helping readers to understand the scientific content easier and faster, infographics foster dissemination of scientific knowledge and is in line with the tendency of scientific vehicles, like BMJ Posters, F1000 Posters, JoVe, ScienceOpen and ResearchGate that incentivize the use of visuals to attract readers to science. Competent visual design foster science comprehension and also helps scientific content to be shared beyond the academia. We want to invite authors, universities and Life Science research-based companies to try the product for free.
 Product URL: http://postermaker.ai/
Tutorial video: https://www.youtube.com/watch?v=sP73wbJVeM4
About Mind the Graph
Mind the Graph is an EdTech that uses infographics to explain scientific information in a simpler and visual appealing way. It was founded by the joined efforts of a Life Science Researcher and a Graphical Designer. The focus of the company is to create products that empower scientists, fostering the design of impactful professional-looking infographics with pre-assembled scientifically accurate illustrations available in an online platform. “We turn scientist into designers” is our motto. Mind the Graph products are currently online and sold under subscription (i.e. SAAS), summing up around 500K users worldwide. The company also provides design services for pharmaceutical and healthcare companies, helping to improve understanding and adoption of health products.
Why does that matter for Life Sciences and Healthcare?
Medical, health Science and Life sciences are by far the most active community when it comes to scientific publishing. Some estimates range between 60% and 80% of the whole scientific content to be in this area. Just biomedical publications comprise 35% of all the journals in the world. Therefore, scientific communication is a big challenge for authors in this field. Needless to say, biomedical studies are really expensive and often linked to governmental research grants. Using innovative tools to foster public awareness of science is a matter of public interest. This new launch combines a patent-pending technology of image creation with an artificial intelligence engine to create an innovative design experience for scientific content that helps disseminate biomedical / health content and contributes to health literacy. The product is helpful for authors in several Life Science and medical areas, such as Cardiology, Neurology, Surgery, Urology, Gynecology, Obstetrics, Clinicians, Pneumonology, Endocrinology, Orthopedics, Pediatrics, Hematology, Immunology, Parasitology, Neuroscience, Pharmacology, Medicine, Nutrition, Pharmacy, Odontology, Nursing as a well as broad Biology areas, like Zoology, Botany, Cell Biology, Biochemistry, Genetics, Molecular Biology and is therefore very useful to research laboratories in any biomedical, health and life Science related fields (check https://app.mindthegraph.com/gallery).
Written by Dr. Fabricio Pamplona, Mind the Graph co-founder
Of relevance, the company founder is also a researcher in Pharmacology and partnered up with a designer to start this technology venture 6 years ago. If you want more information about this topic, feel free to contact me directly:
Key References
• Economist Graphic details - https://www.economist.com/science-and-technology/2016/06/16/graphic-details
• Report of the International Association of Scientific, Technical and Medical Publishers - An overview of scientific and scholarly journal publishing
• https://www.stm-assoc.org/2015_02_20_STM_Report_2015.pdf
Related products and infographics/posters repositories
• https://www.scienceopen.com
• https://www.researchgate.net/
• https://f1000research.com/browse/posters
• https://bmcmedicine.biomedcentral.com/
Mind the Graph is featured in relevant articles of scientific communication:
• Considerations for effective science communication
• A picture is worth a thousand words in medical writing
• Scientific communication: the art of preparing and presenting scientific results
• A Picture Is Worth a Thousand Views: A Triple Crossover Trial of Visual Abstracts to Examine Their Impact on Research Dissemination
• A Crossover Randomized Trial of Visual Abstracts Versus Plain-Text Tweets for Disseminating Orthopedics Research
• An Integrated Guide for Designing Video Abstracts Using Freeware and Their Emerging Role in Academic Research Advancement
Complete information regarding Mind the Graph available in this link.
